![]()
High Resolution Alignment of Single-Cell and Spatial Transcriptomes
CytoSPACE is a computational tool from the Newman Lab for assigning single-cell transcriptomes to in situ spatial transcriptomics data, enabling high-resolution tissue cartography.
This site provides a web interface for running CytoSPACE with standard options for bulk ST data such as 10x Visium. Full source code with additional options, including single-cell mode, is available on GitHub.
Please note that this a beta version of the CytoSPACE website, and we are actively making improvements. We appreciate your patience and welcome any feedback via email at cytospaceteam@gmail.com.
© Stanford University 2023
About
Overview of CytoSPACE
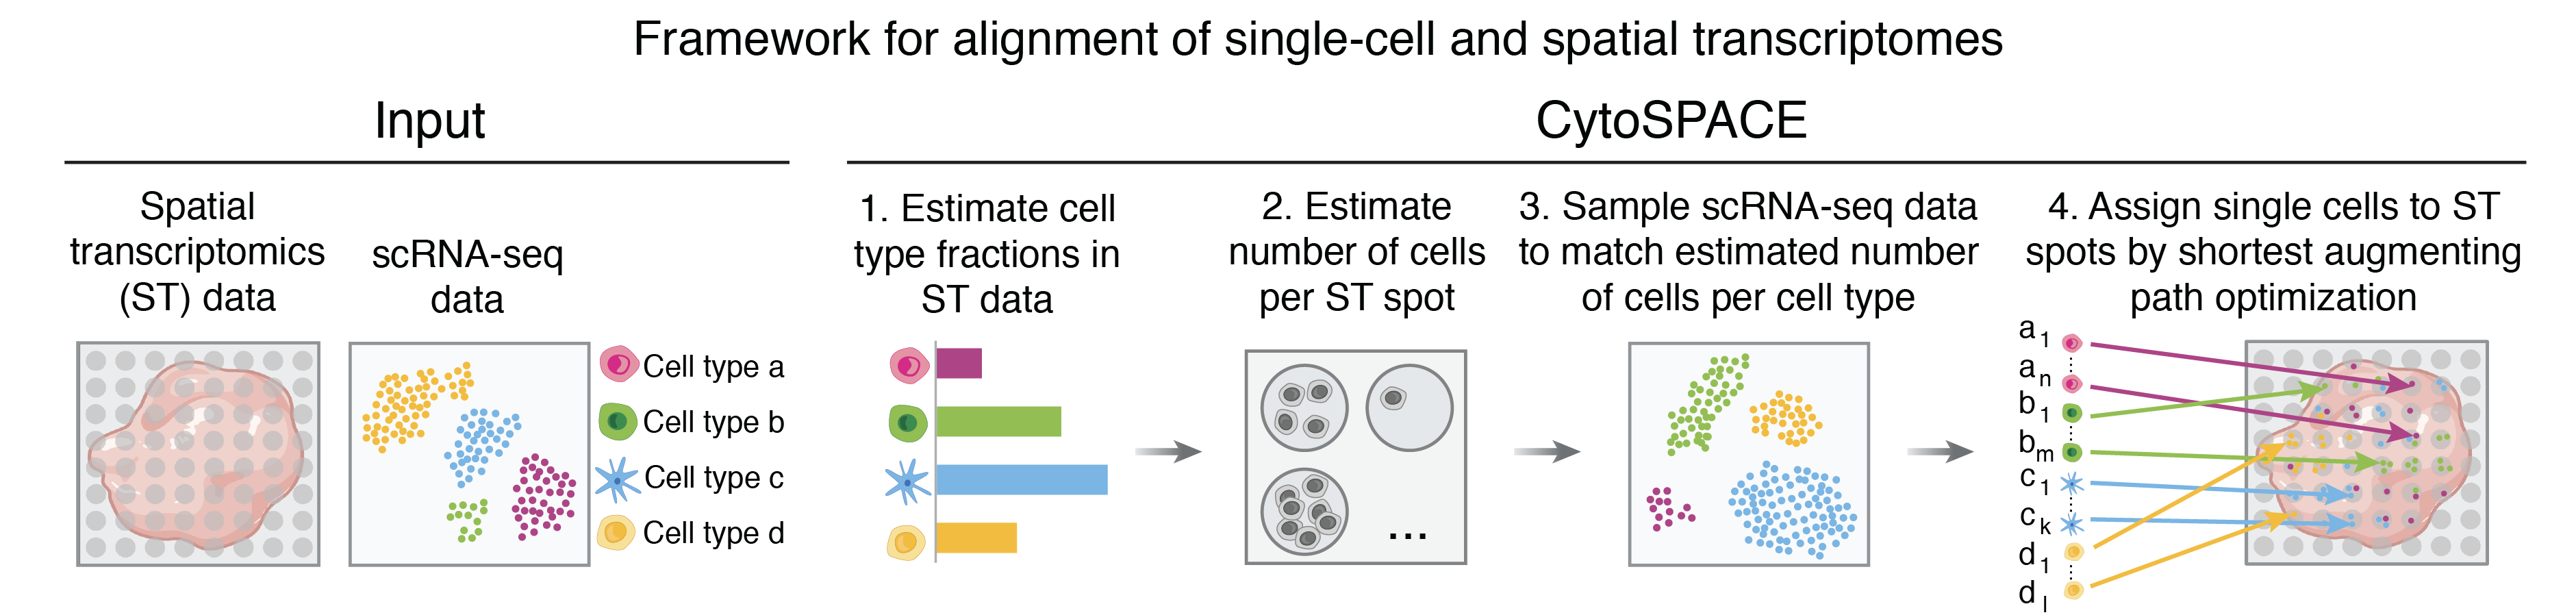
CytoSPACE is a computational method for assigning single-cell transcriptomes to in situ spatial transcriptomics (ST) data, requiring as input spatial transcriptomic profiling of a tissue specimen and an annotated scRNA-seq atlas and yielding a reconstructed tissue specimen with both high gene coverage and spatially-resolved scRNA-seq data suitable for downstream analysis. CytoSPACE is offered in both bulk ST and single-cell ST modes.
Bulk ST mode
Bulk ST mode is suitable for any ST data lacking single-cell resolution, such as that from 10x Visium or legacy platforms. These data generally have high gene recovery but are not immediately suitable for single-cell or cell-type-dependent analyses given their resolution. For such data, CytoSPACE outputs can be used to understand cellular substructures, identify colocalization patterns of cell types, analyze differential expression of genes within a cell type according to location, and more.
Single-cell ST mode
Single-cell ST mode is suitable for any ST data with single-cell resolution, such as that from Vizgen MERSCOPE data. While these data have single-cell resolution, they generally have much lower gene recovery and can be prone to noise. For such data, CytoSPACE outputs can be used to enhance gene recovery.
CytoSPACE framework
CytoSPACE works by constrained global optimization to yield robust mappings of single cells to tissue. It operates over the full transcriptome without reduction to pre-selected marker genes or a shared embedding space, thereby retaining sensitivity to subtle cell states.
Optimization framework
Specifically, CytoSPACE constructs (1) a set of input scRNA-seq matching what is predicted to be present in the ST sample, and (2) a set of "sub-spots" available within the ST sample according to the predicted cellular density at each location. With these matched sets, CytoSPACE formulates the tissue reconstruction task as a linear assignment problem and optimally arranges the set of selected scRNA-seq across the set of sub-spots according to a cost function based on transcriptomic concordance between cells and spots.
Bulk ST mode
Given bulk ST data and an annotated scRNA-seq atlas, CytoSPACE first estimates overall cell type fractions in the tissue as well as the number of cells per spot, using these to construct the matched sets.
By default, CytoSPACE estimates the fractional abundance of cell types in the ST specimen using Spatial Seurat. Users may also provide fractional abundance estimates generated by an external deconvolution tool such as Spatial Seurat as well as RCTD, SPOTlight, cell2location, or CIBERSORTx, if desired.
Similarly, CytoSPACE accepts but does not require user-provided estimates for the number of cells per spot, calculating these constraints internally according to a model associating detectably expressed genes with the number of cells contributing mRNA content within a spot. If imaging data is available, users may also provide their own estimates, including those generated by visual cell segmentation methods such as VistoSeg and Cellpose.
Single-cell ST mode
CytoSPACE works similarly in single-cell mode, constructing matched sets of input scRNA-seq data and single-cell ST data and then mapping betewen them. In this case, no cellular density estimate is required. Cell type fractional abundances can be explicitly constrained by user-provided annotations of the single-cell ST data or estimated in the same way as for bulk. In single-cell ST mode, CytoSPACE can separate matched sets by cell type before mapping when single-cell ST annotations are available or map all cells together according only to overall fractions.
Website features
The site offers an interface for running CytoSPACE in bulk mode with basic parameters. The web implementation of CytoSPACE has been adjusted for efficiency and simplicity and must be run with the "lap_CSPR" solver option and with subsampling parallelization ("-sss -nosss 1000"; mapping of 1,000 cells at a time) enabled. Empirically, performance is generally comparable to mapping without subsampling. For single-cell mode, larger files, and extended options, CytoSPACE should be run from source code for the time being.
Tutorials for running CytoSPACE from the web app as well as from source code are provided, as are example datasets for download.
Additional resources
For further details regarding the method and its validation, please refer to the publication release.
To access the full source code, please see the GitHub repository.
To contact the CytoSPACE team, please direct emails to cytospaceteam@gmail.com.
Contact


Run CytoSPACE
Mean Number of Cells per Spot = 20 and ST Platform Geometry = Square
Additional Parameters
Additional Parameters
Single-Cell Reference Dataset
Spatial Transcriptomics Dataset
Cell Type Fraction Estimates
Note: For the Melanoma Example Dataset and custom data from legacy ST platforms, we recommend setting additional parameters:
Mean Number of Cells per Spot = 20 and ST Platform Geometry = Square
Additional Parameters
CytoSPACE run failed. Please check the error message and try again.
Error Message:
Log File:
Job Results
Downloads
Please refer to the GitHub repository for previous versions and detailed information.
Download Source Code (zip)
This dataset consists of a HER2+ breast cancer scRNA-seq atlas by Wu et al. ( Nature Genetics, 2021 ) and a HER2+ breast cancer FFPE specimen profiled by the Visium platform ( 10x Genomics ).
Due to the size of the files, it may take up to a minute until the download starts.
Download Dataset (zip)
This dataset consists of a melanoma scRNA-seq atlas by Tirosh et al. ( Science, 2016 ) and a melanoma specimen profiled by the legacy spatial transcriptomics platform ( Cancer Research, 2018 ).
Due to the size of the files, it may take up to a minute until the download starts.
Download Dataset (zip)
Tutorials
Input Files
By default, CytoSPACE requires 4 files as input, but this may depend on the type of file the users have. Please see below for further formatting details. All files should be provided in tab-delimited tabular input format (saved as .txt) with no double quotations, except for when providing a tar.gz Space Ranger output.
Due to storage considerations, we may not be able to take file uploads larger than 500MB. Please try to keep the input files under this size. It may be helpful to subset both gene expression files to the genes common to both scRNA-seq and spatial transcriptomics datasets, as they are used for CytoSPACE runs.
- A scRNA-seq gene expression file:
- The matrix must be genes (rows) by cells (columns).
- The first row must contain the single cell IDs and the first column must contain the gene names.
- The first column (gene names) must have a header.
- The gene expression data should be represented as non-normalized counts.
- All instances of duplicate gene names will be dropped at runtime.

- A cell type label file:
- Cell type labels corresponding to the single cell IDs in the scRNA-seq gene expression matrix.
- Cell type label strings should not have special characters.
- The table should contain two columns, where column 1 contains the single cell IDs corresponding to the columns of the scRNA-seq matrix and column 2 contains the corresponding cell type labels.
- The columns must have a header.

- A spatial transcriptomics (ST) gene expression file:
- The matrix must be genes (rows) by ST spots (columns).
- The first row must contain the ST spot IDs and the first column must contain the gene names.
- The first column (gene names) must have a header.
- The gene expression data should be represented as non-normalized counts.
- All instances of duplicate gene names will be dropped at runtime.

- A spatial transcriptomics coordinates file:
- A table consisting of 3 columns, where the first column contains the ST spot IDs corresponding to and in the same order as the columns of the ST gene expression matrix, and column 2 and 3 contain the row and column indices of the spatial transcriptomics data, respectively.
- The columns must have a header.

Additional input options
Click to expand section
From Space Ranger outputs
Users starting from Space Ranger outputs can substitute (3) ST gene expression and (4) ST coordinates with a single tar.gz file.
If a Space Ranger output is specified, CytoSPACE will automatically attempt to unzip the provided tarball and load the correponding ST expression and coordinates data.
If there are duplicate gene names in the gene expression file, they will be made unique prior to running CytoSPACE, as is done in Seurat.
The tarball should only include the following:
- A single H5 file (extension .h5) containing the ST gene expression
- A single subdirectory containing the image data
An example file tree for an unzipped tarball is shown below on the left; if downloading from the public 10X Visium data, users can download the files shown below on the right.


From Seurat objects
We provide helper scripts under the Prepare_input_files section of the source code, which users can use to generate the four .txt input files from Seurat objects.
(Optional) Pre-calculated cell type fraction estimates
To account for the disparity between scRNA-seq and ST data in the number of cells per cell type, CytoSPACE requires the fractional composition of each cell type in the ST tissue. By default, CytoSPACE will make estimations internally.
Alternatively, users can choose to provide their own estimated cell type composition. In this case, the provided file must be a table consisting of 2 rows with row names, where the first row contains the cell type labels, and the second row contains the cell fractions of each cell type represented as proportions between 0 and 1. The cell types on the first row should be alphabetically ordered.
If providing this file, please make sure that the cell type labels in the first row match the labels present in the cell type label file, and that the cell type fractions sum to one.

(Optional) Number of cells per spot data
Rather than using the internal mechanism of CytoSPACE for estimating the number of cells per spot, users can provide their own estimates (from image segmentation, for example) in a two-column file with header, in which the first column contains spot IDs and the second contains the number of cells predicted per spot:

Output files
CytoSPACE will produce two plots and four text files by default.
Plots
cell_type_assignments_by_spot.pdf (left) contains heatmaps of cell type assignments within the ST sample. Along with a plot showing the total number of cells mapped to each spot, these show the spatial distribution of cell type assignments. Color bars indicate the number of cells of the respective cell type inferred per spot.
cell_type_assignments_by_spot_jitter.pdf (right) is a single scatterplot showing all assigned cells by their spot location. Each cell is colored based on its cell type.
The plots shown below are generated from our example Visium breast cancer dataset.


Tables and text files
assigned_locations.csv
This file will provide the assigned locations of each single cell mapped to ST spots. As some cells may be mapped to multiple locations depending on the size of the input scRNA-seq set, new cell IDs (UniqueCID) are assigned to each cell and given in the first column. The second column includes original cell IDs (OriginalCID); the third column includes corresponding cell types (CellType); the fourth column includes assigned spot IDs (SpotID); and the fifth and sixth columns respectively includerowandcolumnindices, or xy-coordinates such asXandYif provided in the initial coordinates file, of the corresponding spots.cell_type_assignments_by_spot.csv
This file gives the raw number of cells of each cell type per spot bySpotIDas well as the total number of cells assigned to that spot.fractional_abundances_by_spot.csv
This file gives the fractional abundance of cell types assigned to each spot bySpotID.log.txt
This file contains a log of CytoSPACE run parameters and running time.
FAQ
Click to expand section
-
My ST dataset comes from a platform other than 10x Visium. Which additional parameters should I specify?
The default parameter choices are optimized for 10x Visium datasets. For ST datasets generated through the legacy ST platform, where each spot is slightly larger than 10x Visium spots, we recommend that you specify the following parameters:
Mean Number of Cells per Spot : 20
ST Platform Geometry : Square -
My scRNA-seq dataset comes in a format other than a UMI count matrix.
You may want to make the following two changes to the default CytoSPACE workflow.
(1) CytoSPACE’s internal algorithm for estimating cell type fractions was generally written with a UMI count matrix in mind. As an alternative to using the internal algorithm, you may provide your own Cell Type Fraction Estimates file instead. Please see the Additional input options - (Optional) Pre-calculated cell type fraction estimates section above for more information.
(2) CytoSPACE (v1.0.4+) downsamples scRNA-seq datasets to a certain number of transcripts per cell (1500 by default) prior to assignment so that the assignment is not dependent on the total transcript count of each cell. You may want to turn this feature off by specifying the following parameter:
Transcripts per Cell for Downsampling scRNA-seq data : 0 -
Is there a gene expression matrix for the results?
We currently do not provide the gene expression matrix as an output file, as it is often very large in size and takes a long time to write to disk. However, theOriginalCIDcolumn of theassigned_locations.csvfile will consist of the single-cell IDs from the input scRNA-seq expression matrix, which can be used to recover the gene expressions for each cell assigned to each spot. -
Providing the output from Space Ranger (v2.0.0+) results in an error.
We were notified that the instructions for providing the Space Ranger outputs directly as a tarball resulted in errors for the newer versions of Space Ranger. It seems that this is occuring due to a recent format change in Space Ranger outputs, and we are currently working to fix this issue. In the meantime, please use the standard four-file input format, with the ST gene expression and coordinates provided as two separate .txt files. -
I get an error when uploading my files, with a message that starts with
<html> <head lang = "en"> <title>An error has occurred</title>.
This could be an issue with the storage availability in our internal storage. Please let us know at cytospaceteam@gmail.com, and we would be happy to assist.